An expense ratio is the annual percentage of a fund's assets deducted for operating costs, and it compounds because the deduction repeats each year on the remaining balance. The asset-weighted average expense ratio across U.S. funds was 0.36% in 2023, down from 0.87% in 2004, per Morningstar's 2024 fee study, a decline documented across two decades.
The arithmetic below is illustrative and descriptive of mechanics; it does not project what any fund will return and recommends nothing.
What does an expense ratio include?
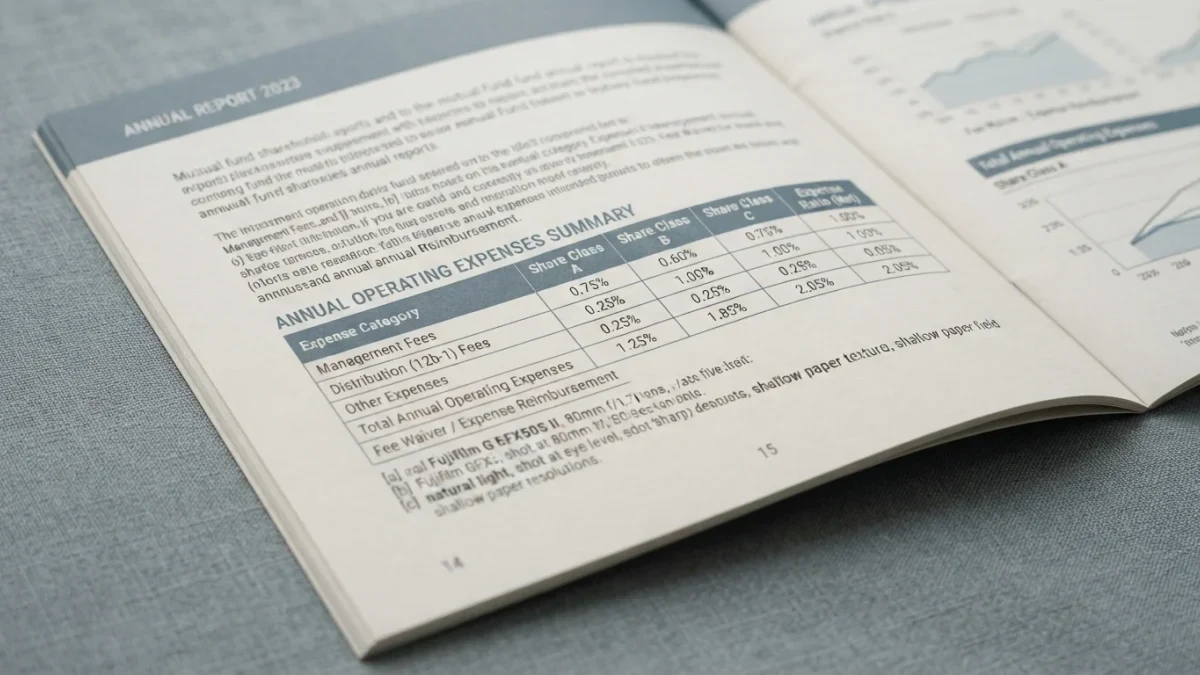
An expense ratio bundles the recurring costs of running a fund: the management fee paid to the adviser, distribution and service (12b-1) fees where a share class carries them, and other operating expenses such as custody, accounting, and audit. The deduction is embedded in the fund's net asset value daily, so shareholders never receive a separate bill for it.
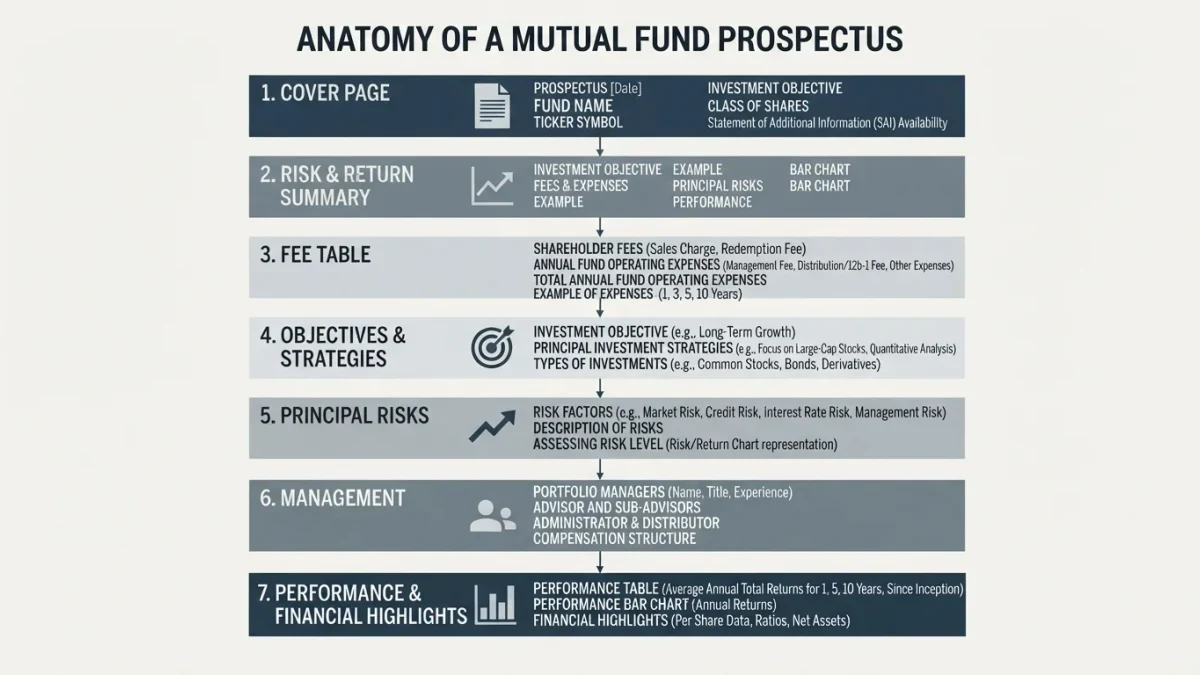
The ratio excludes per-transaction charges, including sales loads, redemption fees, and brokerage commissions, which appear separately in the prospectus fee table. Many fact sheets print both a gross ratio and a net ratio, the latter reflecting fee waivers; the net figure, together with any waiver expiration date, is the one that applied to assets in the stated period.
How does a recurring percentage compound?
The mechanism is subtraction that recurs. A fee reduces each year's net return, and the dollar amount removed in early years would itself have earned the fund's return in later years. Over a single year the difference between two ratios looks trivial; across decades the deducted dollars and their forgone growth accumulate into a materially different ending balance.
Illustrative arithmetic makes the scale visible. Assume a $10,000 starting balance, a constant 7% annual gross return, no contributions or withdrawals, and fees deducted each year: a 0.50% ratio leaves a 6.5% net return, and a 1.00% ratio leaves 6.0%. Over 20 years the two paths end at $35,236 and $32,071 respectively, a difference of $3,165, with the higher-fee balance about 9% smaller. The fee difference was 0.50 percentage points; the terminal difference approached a third of the starting amount.
How do fee levels compare across horizons?
The table extends the same illustrative model, using the same assumptions: $10,000, a constant 7% gross return, annual fee deduction, and no cash flows. A constant-return model is a calculation device, not a forecast; real funds return uneven amounts and can lose value.
| Expense ratio | Net annual return | 10 years | 20 years | 30 years |
|---|---|---|---|---|
| 0.05% | 6.95% | $19,580 | $38,337 | $75,063 |
| 0.50% | 6.50% | $18,771 | $35,236 | $66,144 |
| 1.00% | 6.00% | $17,908 | $32,071 | $57,435 |
Reading across the rows shows the pattern: the 0.05%-fee and 1.00%-fee paths separate by $809 after ten years and by $17,628 after thirty. The spread widens with time because every year's gap compounds on top of the earlier ones, the same mechanism that grows the balance itself.
What does the documented evidence show about fees and outcomes?
Fees are among the few inputs to fund results known in advance, and the documented record connects them to outcomes. Morningstar's fee studies have repeatedly found that the cheapest quintile of funds has been more likely to survive and more likely to outperform its category average than the most expensive quintile, a pattern the 2024 edition reported again.
The same research characterizes fees as the most consistently reliable predictor among the metrics tested, ahead of past performance itself. That finding is a statement about statistical tendency across thousands of funds, not a guarantee about any single holding, and it survives as documented evidence rather than as a projection.
How do waivers and reimbursements change the picture?
Some funds temporarily reduce their stated ratio through fee waivers or expense reimbursements, and the disclosed net ratio applies only while the arrangement lasts. A contractual waiver carries a stated expiration date, after which the gross ratio resumes unless the arrangement is renewed, and funds must disclose both figures alongside each other.
The documented industry trend runs in the payer's favor regardless: the long decline in asset-weighted averages since 2004, per Morningstar's fee study, has been driven largely by flows into low-cost passive funds and repeated cuts by sponsors competing for those flows. Waivers matter most at the margin, where a young fund caps its net ratio near launch to stay comparable with established peers, and the gross figure is the one that governs once the cap lapses.
Which costs sit outside the ratio?
Several charges never touch the expense ratio. Sales loads and redemption fees are shareholder-level transaction costs recorded in the fee table. Brokerage commissions on portfolio trades are a fund-level trading cost reflected in prices rather than the ratio, and ETF buyers additionally face bid-ask spreads and any premium or discount to net asset value at execution.
These omissions cut in both directions: two funds with identical ratios can carry different total ownership costs once trading behavior and transaction charges are counted. The SEC's investor guidance on understanding fees groups these costs and is the reference for which charge belongs where.
How should the arithmetic be weighed?
The documented trade-off is asymmetry of certainty. A fee is fixed, known, and compounds relentlessly; gross return is uncertain and swings by year. The evidence above links lower fees to better odds of survival and outperformance across fund populations, while index tracking quality, tax consequences, and transaction costs are real offsets that the ratio alone does not capture.
None of this fixes what any investor should pay, which depends on circumstances outside this article's reach. What the arithmetic does establish is the unit of comparison: a percentage point of fee is not a one-time subtraction but a recurring claim on every future year's balance, which is why the subject rewards the attention it gets.