
A fund fact sheet is a short summary that a fund sponsor updates regularly to present a fund's objectives, performance, risk measures, holdings, and fees in a standardized format. The asset-weighted average expense ratio across U.S. funds fell to 0.36% in 2023, per Morningstar's 2024 fee study, and the fact sheet's fee line shows where that cost sits.
Horison publishes information, not investment advice, and how any fund fits a particular portfolio depends on individual circumstances this publication cannot know. A fact sheet reports what a fund has done and what it costs; it does not establish whether the fund suits a specific investor, and nothing here is a recommendation to buy or sell anything.
What belongs on a fund fact sheet?
A fund fact sheet is a marketing document, not a legal one. Most run two pages and appear monthly or quarterly, covering the same block of fields: objective, inception date, manager tenure, performance, risk metrics, top holdings, sector or country weights, and fees. The legally binding disclosure sits in the prospectus, and the fact sheet is best read as its compressed preview.
Standardization is the document's main value. Because fields appear in a similar order across sponsors, two funds in the same category can be laid side by side and compared line by line. That comparison works only when the periods match, a point covered under the performance section below.
How is the performance section read?
Performance on a fact sheet is reported after fund operating expenses are deducted, and U.S. fund advertising rules require standardized one-, five-, and ten-year periods alongside shorter spans (SEC Rule 482 framework). Returns are typically shown both cumulatively and annualized, next to a named benchmark over the same window.
Three checks make the numbers comparable. First, confirm the period end date, because two sheets can both say "one year" while ending months apart. Second, confirm the benchmark: an equity fund measured against a bond index tells the reader little. Third, note whether a figure is cumulative or annualized, since a ten-year cumulative number is far larger than its annualized equivalent.
Every fact sheet carries a version of the legend that past performance does not guarantee future results. That sentence is a regulatory requirement, not decoration, and it applies to every figure in the section.
Which risk metrics appear, and what do they measure?
Most fact sheets report the same small set of quantitative risk measures, usually computed on monthly or annual returns over three or five years. Each answers a different question about variability rather than about return itself.
| Metric | What it measures | What to check |
|---|---|---|
| Standard deviation | How widely returns swing around their own average | Compare only within the same category and period |
| Sharpe ratio | Return earned per unit of volatility above a risk-free reference | Useful mainly against funds sharing the same period and index |
| Beta | Sensitivity of fund returns to moves in a benchmark | Check which benchmark; values above 1 historically amplified index moves |
| Alpha | Return left over after accounting for beta | Model-dependent; low R-squared makes it hard to interpret |
| R-squared | Share of fund movement explained by the benchmark | Low values weaken the meaning of beta and alpha |
These statistics describe the past distribution of returns, not the risk of future loss. A fund with a modest five-year standard deviation can still post sharp losses, and the metrics say nothing about concentration inside the portfolio, which the holdings section addresses.
What do holdings and portfolio data reveal?
The holdings block lists the fund's top ten positions with weights, the total number of holdings, and breakdowns by sector and geography. The sum of the top ten weights is the fastest concentration check available: a heavy top ten means results depend heavily on a short list of companies.
Bond funds substitute duration and credit-quality tables for sector weights. Duration approximates price sensitivity to interest-rate changes, and the credit table shows how much of the portfolio sits in investment-grade tiers. Both fields belong to the same as-of date printed on the page, which should be checked before any comparison.
Two supporting fields round out the picture. Portfolio turnover indicates how quickly the manager replaces holdings, and manager tenure shows how long the listed team has run the strategy; a strong ten-year record attributed to a manager in seat for two years is a different object than the same record suggests.
Which fee lines matter most?
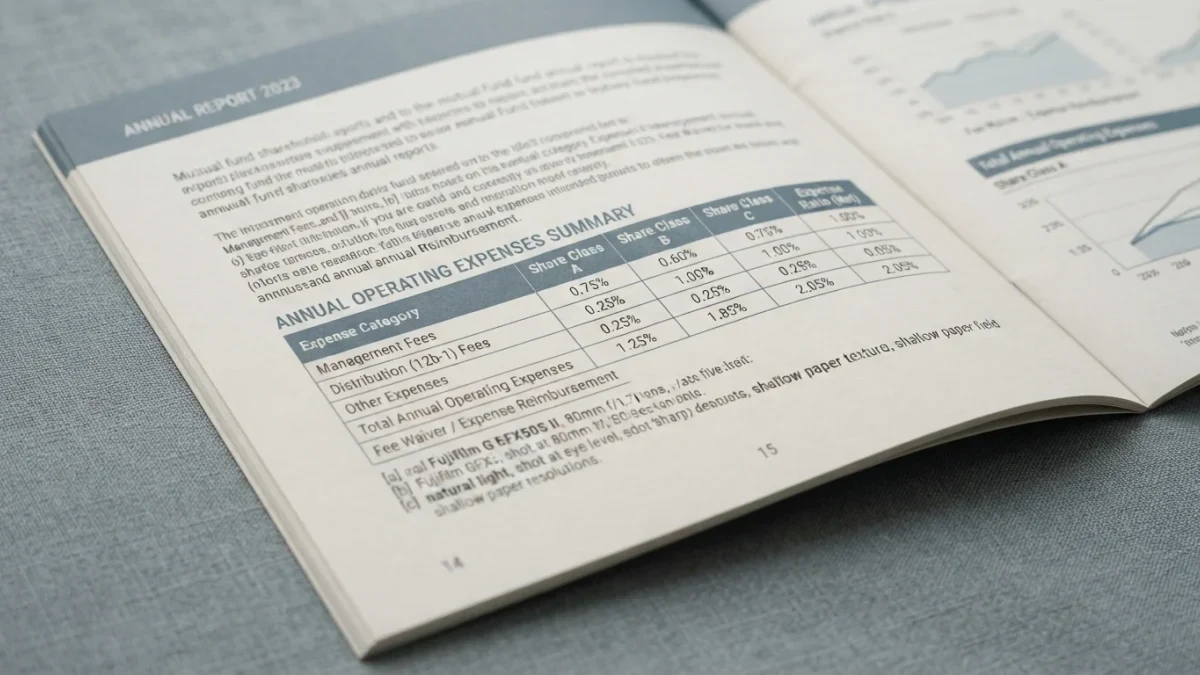
The fee block centers on the expense ratio, the annual percentage of assets deducted for operating the fund. Many sheets show both a gross figure, before fee waivers, and a net figure actually charged. Transaction charges such as front-end or deferred sales loads, where a share class carries them, are separate lines rather than part of the ratio.
The net expense ratio is the number to carry into comparison, together with its waiver expiration note where one applies. Fund-level fees compound over time in a way a single percentage point understates, a mechanism treated in its own Horison explainer on fee compounding.
What does a fact sheet leave out?
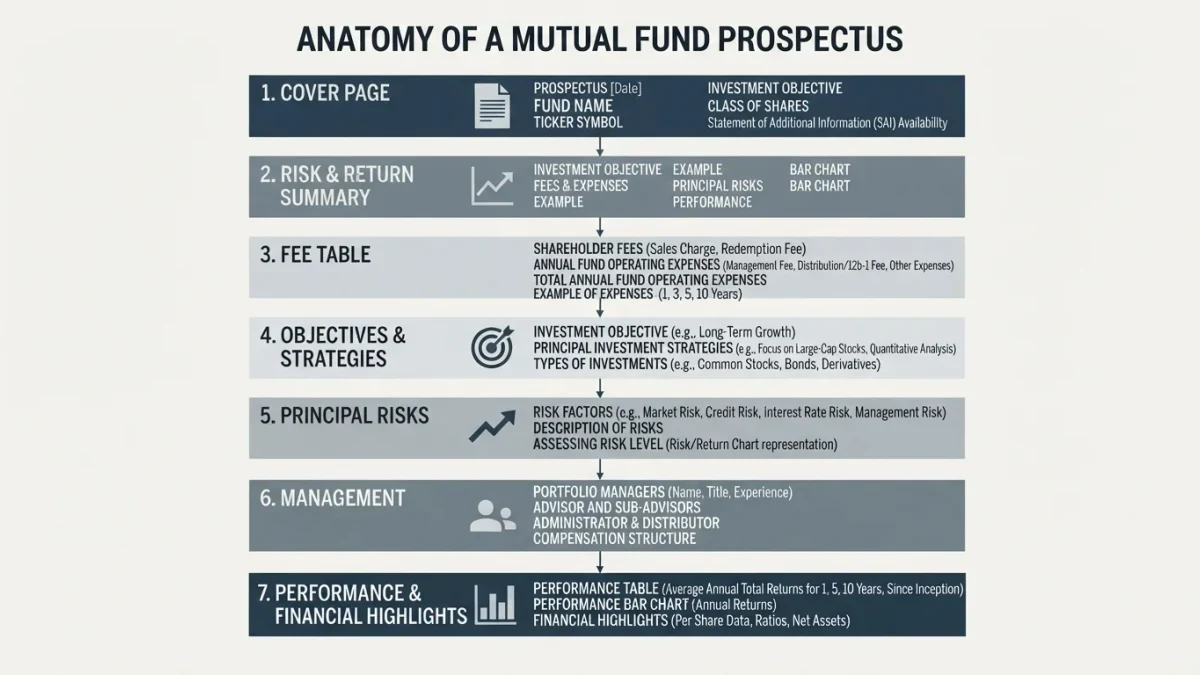
A fact sheet is unaudited marketing material. Full holdings appear in the annual and semi-annual shareholder reports, and the complete legal picture, including strategies, risks, and fee structures by share class, sits in the prospectus and its Statement of Additional Information.
The sheet also omits behavior: it shows fund returns, not the timing of the cash flows investors actually made. For that distinction, dollar-weighted investor returns in studies such as Morningstar's annual "Mind the Gap" analysis are the relevant source. A disciplined reader treats the fact sheet as the first filter in a longer document trail rather than the last word on a fund.