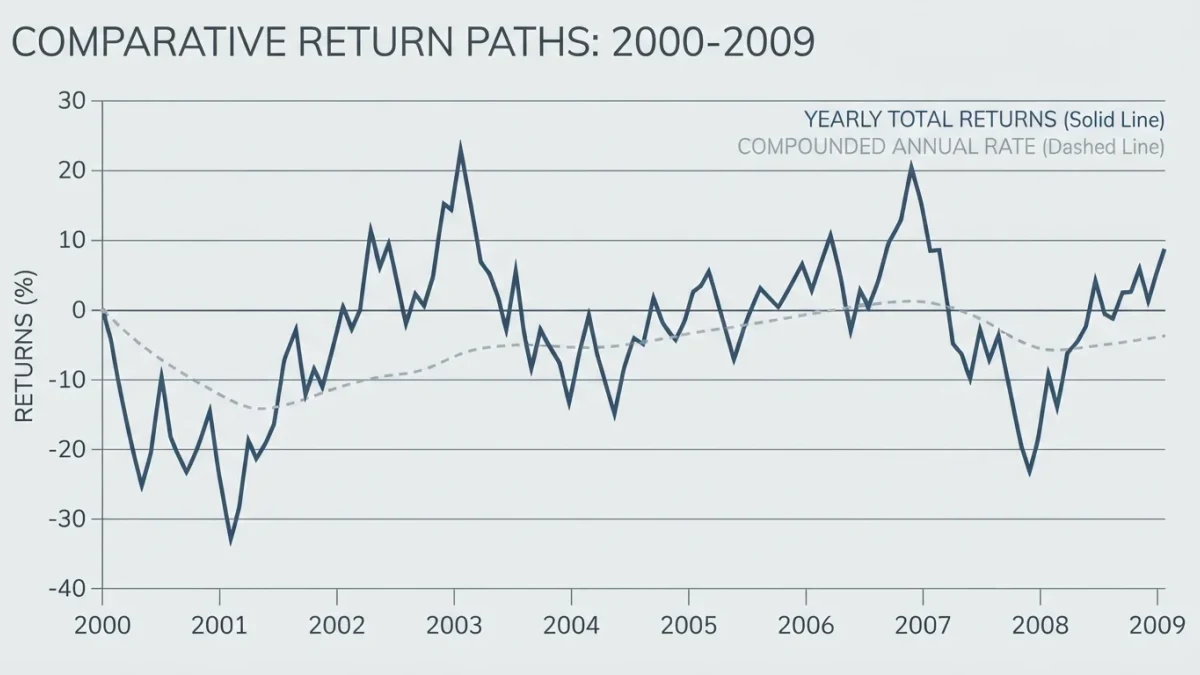

Total return is the full percentage change in an investment's value with dividends and interest reinvested, while price return counts the change in market price alone. Over 2000-2009 the S&P 500's price level fell from 1,469.25 to 1,115.10, an annualized price return of −2.7%, while reinvested dividends lifted the annualized total return to −1.0% (S&P Dow Jones Indices data).
The figures below are historical and illustrative; they are not projections, and no comparison recommends any investment.
What does each measure include?
Price return is the percentage change in an instrument's quoted price between two dates, ignoring any cash the holding paid out. Total return adds those distributions back and assumes each was reinvested immediately in the holding at its then-current price, so the calculation compounds the payouts as well as the price.
The convention matters because familiar numbers sit on different sides of it. The headline S&P 500 level quoted in market reports is a price index; fund performance tables, by contrast, are calculated on a total-return basis after fund fees, with distributions reinvested. Germany's DAX takes the third position: it has been calculated as a total-return index, counting reinvested dividends, since its introduction — a fact that makes its long-term figures incomparable with price-only benchmarks without adjustment (Deutsche Börse index documentation).
Why does the gap widen over time?
Reinvested distributions do work of their own. Every dividend reinvested buys additional shares, and those additional shares generate the next round of distributions, so the difference between the two bases compounds rather than adds. Over a single year with a 2% yield the two measures differ by roughly the yield; over decades the divergence accumulates on itself.
Illustrative arithmetic shows the scale. Assume $10,000, a constant 8% annual price return against a 10% total return — a 2-point reinvestment stream — no taxes, and no cash flows over 30 years: the price-only path ends at $100,627 and the total-return path at $174,494. The illustrative gap, more than $70,000, is not a forecast of any index; it is what compounding does to a seemingly small annual difference.
Where does the gap appear in documented data?
The 2000-2009 stretch is the documented example this article opened with. A price-only holder of the S&P 500 lost 2.7% per year compounded; a holder who reinvested every dividend lost about 1.0% per year. The distributions did not prevent the loss — they cushioned it by roughly 1.7 percentage points annually across a decade in which the price index went nowhere.
The size of the cushion tracks the yield. Higher distribution streams widen the wedge between the two bases, which is why bond funds, high-dividend equities, and real-estate funds show larger total-versus-price gaps than low-yield growth stocks, and why the gap shrinks when yields fall — a documented relationship, not a constant.
Which conventions trip readers up?
Most confusion comes from mixing bases in a comparison. The table lists the common instruments and what their quoted figures normally represent.
| Quoted figure | Usual basis | What it excludes |
|---|---|---|
| Index headline level (S&P 500, Dow) | Price return | All cash distributions |
| Fund performance table | Total return, net of fund fees | Sales loads; taxes in the standard figure |
| DAX headline level | Total return | Nothing by design; incomparable with price indexes unadjusted |
| Dividend yield | Annual cash distribution rate | Price change entirely |
| Media "the market rose 1%" | Usually price change | Reinvested distributions |
What does the reinvestment assumption require?
Total-return math assumes frictionless reinvestment: distributions are reinvested promptly, no tax is due on them, and no transaction costs apply. Real accounts deviate on all three — dividends may arrive as cash, taxes may be owed the year they are paid, and reinvestment may carry fees — so an investor's realized outcome can trail the published total-return figure even in a fund that was never sold.
Prospectuses handle part of this by publishing standardized after-tax returns alongside the pre-tax figures, a Form N-1A requirement, so taxable-account holders can see a second basis. The lesson for reading any performance number is to check which assumptions stand behind it before comparing it to another.
How should the two numbers be compared?
Like must be compared with like. A price-only index figure next to a fund's total-return figure overstates the fund's advantage; two funds on the same total-return basis are directly comparable; and any long-horizon statement built on price-only data will understate the historical record of distribution-paying assets by an amount that compounds with time.
The SEC's Annual Return glossary entry on Investor.gov defines the standard measurement convention, and it is the reference this article follows. Total return is the honest default for describing what a holding delivered; price return remains the honest description of what the quoted level did — and the gap between them is the documented, compounding cost of forgetting the difference.