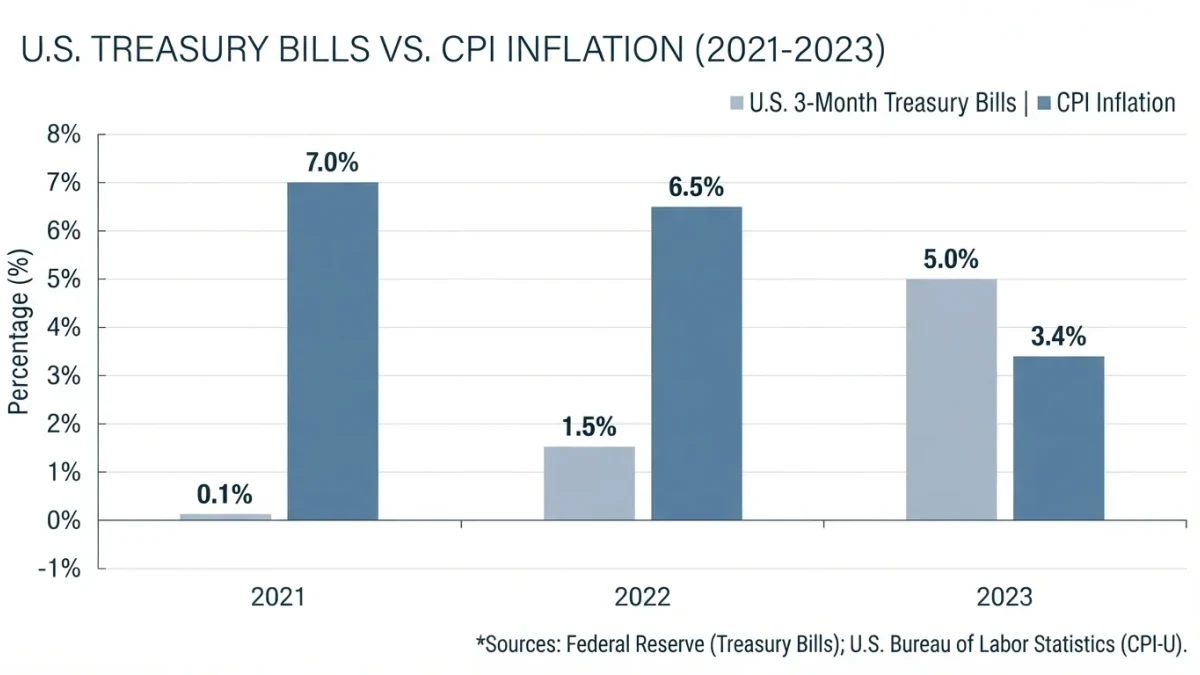
Cash is the asset class made up of demand deposits, savings accounts, money market funds, and short-term Treasury bills, held mainly for liquidity and price stability rather than growth. Three-month Treasury bills returned roughly 5 percent in 2023 while consumer inflation ran at 3.4 percent, per U.S. Treasury and Bureau of Labor Statistics data.
This explainer documents the recorded behavior of cash, the criticisms published in portfolio research, and the carry arithmetic that follows from holding it.
What counts as cash in portfolio construction?
In allocation documents, cash is a label for a cluster of short-term instruments rather than for currency alone. The cluster typically includes insured bank deposits, government money market funds, and Treasury bills maturing within a year. Accounting practice is stricter still, recognizing as a cash equivalent only instruments with original maturities of three months or fewer.
Each instrument trades return for immediacy. Deposits at a bank carry federal insurance up to 250,000 dollars per depositor, per bank and ownership category. Money market funds hold short securities and maintain, but do not guarantee, a stable one-dollar share price; the last widely cited deviation was the Reserve Primary Fund in September 2008, whose net asset value fell to 97 cents.
The scale of the category is documented. Money market fund assets crossed 6 trillion dollars in late 2023, according to Investment Company Institute weekly data, after short-bill yields reached their highest levels in more than a decade. Cash is therefore not a residual in modern portfolios but one of the largest pools of invested money in the United States.
How has cash performed against inflation?
The real outcome on cash — nominal yield minus inflation — has swung in both directions within a single four-year window. In 2021, three-month bills returned approximately zero while consumer prices rose 7.0 percent. In 2022, bills returned roughly 1.5 percent against 6.5 percent inflation, a second consecutive negative real year, per Treasury yield data and Bureau of Labor Statistics measures.
The pattern reversed in 2023. The Federal Reserve held its target range at 5.25 to 5.50 percent from July 2023, bills returned roughly 5 percent, and December-over-December inflation printed 3.4 percent — a positive real yield for the first time in that window. Rate cuts beginning in September 2024 brought the target range to 4.25 to 4.50 percent by December 2024, and short-dated yields followed the policy rate down.
What is carry, and why does it matter for cash?
Carry is the yield collected for simply holding a position over a period, before any price change. For cash, gross carry is the stated yield on the deposit, fund, or bill; the figure that matters for purchasing power is real carry, the yield after inflation. Negative real carry — the condition of 2021 and 2022 — means the account balance grows while what it can buy shrinks.
Two mechanical points follow. First, cash carry reprices quickly: a bill rolling every month picks up market yields within weeks, unlike a fixed-coupon bond held to maturity. Second, that same rollover creates reinvestment risk, because the yield available at the next roll is unknown in advance — the mirror image of the price risk a longer bond carries.
What are the documented criticisms of holding cash?
The longest-standing criticism is cash drag. Over 1928 to 2023, Treasury bills compounded near 3.3 percent a year against roughly 10 percent for U.S. equities, per the Damodaran datasets at NYU Stern, and bills trailed inflation across several full decades. A gap of that size compounds into large differences in terminal wealth, which is why long-horizon frameworks treat cash as a liquidity reserve rather than a growth engine.
A second criticism is behavioral. Elevated cash positions have historically clustered after market declines, when yields on newly rolled bills are often already falling — the 2020 and 2022 episodes both fit that shape in the recorded flow data. The documented counterargument is equally old: cash carries no drawdown, needs no forced sales to fund spending, and supplies the inventory from which rebalancing after equity declines is done.
| Instrument | Documented yield basis | Documented risk | Backing or insurance |
|---|---|---|---|
| Insured bank savings | Administered rate, reset at the bank's discretion | Rate may lag market yields | Federal deposit insurance to 250,000 dollars per depositor, per bank, per ownership category |
| Government money market fund | Net yield on short bills and repurchase agreements | Share price can deviate from one dollar, as in September 2008 | No federal deposit insurance |
| Treasury bills | Auction-determined discount yield | Price moves if sold before maturity | Full faith and credit of the U.S. government |
How does cash interact with the rest of an allocation?
Cash enters portfolio arithmetic through the variance formula: an asset with near-zero volatility pulls the portfolio's standard deviation toward zero in proportion to its weight. An illustrative two-asset case shows the direction — assume equities at 16 percent volatility, bills near zero, and a 70/30 split; portfolio volatility falls to roughly 11 percent under those stated assumptions, not to 70 percent of 16. The illustration is arithmetic, not a forecast.
Cash also serves as the settlement medium for rebalancing, a role documented in practice rather than assumed in theory. When a policy weight drifts, the cheapest corrective trade is often a transfer from the cash sleeve rather than a sale of appreciated securities, which keeps realized gains — and any tax attached to them — out of the ledger. Withdrawal frameworks use the same property in reverse: spending drawn from cash during an equity drawdown avoids selling risk assets at their lows, the mechanic that gives the buffer its documented value in retirement studies.
Both uses have documented limits. A cash sleeve large enough to fund several years of withdrawals multiplies the cash-drag arithmetic across those years, and a sleeve too small loses the optionality it was funded to provide. Frameworks differ on where the line sits, and the recorded debate is about magnitude, not about the existence of the trade.
That dampening is why balanced funds hold dealing buffers and why withdrawal frameworks count a spending reserve separately from risk assets. The same arithmetic is also the standing criticism: every unit of dampening is purchased with the return spread documented above, and the price of the insurance only becomes visible over long horizons.