
Risk parity is an allocation approach that equalizes each asset class's contribution to total portfolio risk rather than its share of capital, typically adding leverage to reach a target volatility. Bridgewater's All Weather strategy, launched in 1996, is the documented origin, and Edward Qian's 2005 Financial Analysts Journal work formalized the risk-budgeting arithmetic.
Horison publishes information, not investment advice, and whether any allocation structure suits a portfolio depends on individual circumstances — risk capacity, borrowing tolerance, and horizon — that a reference publication cannot know. This explainer documents the mechanics, the leverage assumptions, and the published criticisms and defenses.
How does risk parity weight assets?
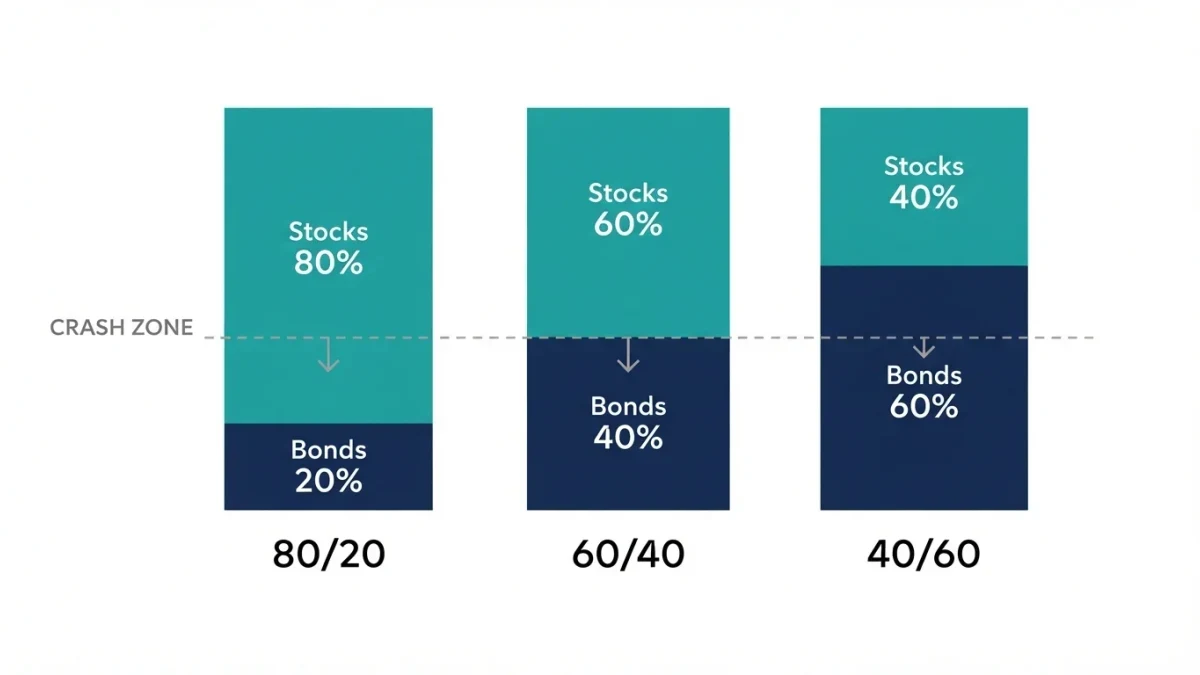
Risk contribution is the share of total portfolio volatility attributable to one holding: its weight, multiplied by how much its returns co-move with the portfolio, divided by portfolio volatility. A conventional balanced portfolio is sharply unequal on this measure. Because equities are far more volatile than bonds, a 60/40 mix receives the overwhelming majority of its risk from the equity sleeve.
An illustrative two-asset case quantifies the point. Assume equities at 16 percent annualized volatility, bonds at 5 percent, and a correlation of 0.2 — all assumptions stated. A 60/40 split then carries portfolio volatility near 10.2 percent, and equities contribute roughly 92 percent of that variance. Re-weighting to about 24 percent equities and 76 percent bonds equalizes the two contributions, with portfolio volatility falling to roughly 5.9 percent. The figures are arithmetic under the stated assumptions, not a forecast.
| Illustrative portfolio | Weights (equity / bonds) | Portfolio volatility | Equity share of risk |
|---|---|---|---|
| Conventional mix | 60 / 40 | Approximately 10.2 percent | Roughly 92 percent |
| Equal risk contribution | Approximately 24 / 76 | Approximately 5.9 percent | 50 percent |
| Levered risk parity | 24 / 76, scaled about 1.7 times | Approximately 10.2 percent | 50 percent |
The illustration exposes the strategy's defining tension in one line: equalizing risk slashes volatility, and the leverage row exists to buy it back. Every later criticism and defense attaches to that exchange.
Why does the strategy use leverage?
Equal risk contribution pulls capital toward the least volatile assets, which historically also carry the lowest expected returns. An unlevered risk-parity mix therefore settles at a low expected return along with its low volatility, and most implementations borrow — through futures, swaps, and repurchase agreements — to scale the whole structure up to a volatility target comparable to a conventional balanced portfolio.
The theoretical warrant is documented. Frazzini and Pedersen's 2014 Journal of Financial Economics study, 'Betting Against Beta,' presented evidence that constrained investors bid up high-beta assets, leaving low-beta assets with higher risk-adjusted returns — a pattern that favors levering the safer sleeve rather than concentrating in the risky one. The paper is the standard citation in the strategy's defense.
Leverage is not free. Financing embedded in derivatives sits near short-term policy rates, and any spread above that rate subtracts directly from the return the structure must earn. The 2022-2024 window, with policy rates between roughly 4.25 and 5.50 percent at their peak, raised the financing cost of every levered structure at the same time — a documented headwind the older literature, written near zero rates, had not observed.
What are the documented criticisms?
The first criticism concerns stress dynamics. Volatility spikes force risk-parity managers to cut exposure mechanically to hold their targets, and Anderson, Bianchi, and Goldberg's 2012 Financial Analysts Journal analysis argued that this selling into falling markets amplifies drawdowns rather than damping them. Their paper — 'Will My Risk Parity Strategy Outperform?' — concluded that leverage raises both the dispersion of outcomes and the depth of losses when diversification fails at once.
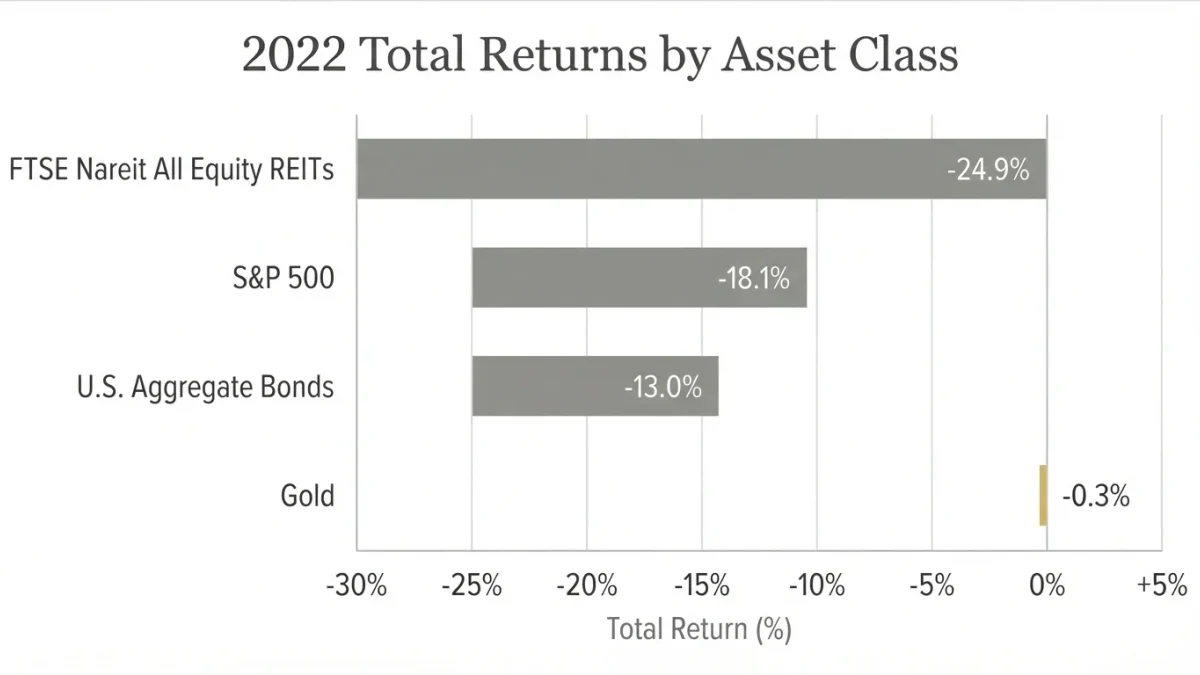
The second concerns estimation. Weights are computed from historical volatilities and correlations, both of which move. In 2022 the S&P 500 returned minus 18.1 percent while the Bloomberg U.S. Aggregate Bond Index returned minus 13.0 percent, so the two sleeves a levered balanced structure relies on fell together; models built on the negative stock-bond correlations of the 2000s and 2010s re-estimated slowly, after the damage.
The third concerns the cash-flow stack. A structure that borrows to own assets pays financing on one side and receives asset yields on the other, so its advantage depends on a spread that policy rates compress. Critics document that the strategy's backtested decades coincided with falling rates, a condition the tests did not have to model separately from the strategy itself.
What is the documented defense?
The defense rests on breadth rather than any single pair. Risk-parity implementations spread risk contributions across equities, nominal bonds, inflation-linked bonds, commodities, and credit, so no single correlation regime dominates the outcome. Proponents present this as the structural difference from a 60/40 portfolio, whose risk remains concentrated in one asset class regardless of regime.
The second line of defense is the leverage-aversion evidence cited above: if low-beta assets persistently offer better risk-adjusted returns, then leverage applied to a balanced low-beta portfolio is compensation for a documented anomaly rather than speculation. Critics accept the premise and dispute the persistence. The site presents both positions as published.
How do the assumptions and criticisms line up?
| Stated assumption | Documented criticism | Documented response |
|---|---|---|
| Volatilities are estimable and stable enough to target | Volatility spikes force mechanical de-risking into weakness | Frequent re-estimation; sizing below the volatility target leaves headroom |
| Correlations diversify the mix | Stocks and bonds fell together in 2022 | Broader asset set reduces reliance on any single pair |
| Financing stays cheap | Policy rates near 5 percent raised levered structures' costs after 2022 | Derivative financing tracks short rates and falls with them |
| Leverage can be scaled safely | Amplified drawdowns and wider outcome dispersion (Anderson et al., 2012) | Leverage applied to a low-volatility base remains below conventional equity risk |
No row resolves. The published record contains a strategy whose mechanics are transparent, whose leverage is the load-bearing assumption, and whose worst documented year — 2022 — struck precisely the correlation the structure depended on. Readers evaluating any implementation against its index benchmark carry that record intact.
Where the evidence is one-sided, it favors this much: the arithmetic of risk contribution is not disputed, only its financing and stability. The disputes, not the arithmetic, are what a reader must weigh.