The 60/40 portfolio is an allocation convention that places 60 percent of assets in equities and 40 percent in fixed income, serving as the shorthand benchmark for balanced investing since the mid-1980s. Its intellectual anchor is Brinson, Hood, and Beebower's 1986 Financial Analysts Journal study, which attributed on average 91.5 percent of pension-return variation to allocation policy.
This explainer documents the mix's history, its 2022 stress episode, and the published criticisms and defenses without ranking them.
Where did the 60/40 mix come from?
Balanced mandates that combined stocks and bonds predate the label by decades, but the modern argument for their primacy traces to a specific study. Gary Brinson, Randolph Hood, and Gilbert Beebower examined 91 large U.S. pension plans over 1974 to 1983 and reported that asset allocation policy explained, on average, 91.5 percent of the variation over time in plan returns. The finding spread quickly through practitioner literature.
Two clarifications matter. The study measured how much of a plan's own return pattern was set by its policy mix, not how much one plan differed from another, and it did not endorse any particular split. The 60/40 convention — roughly the institutional default of the era — became the retail shorthand for that policy-first conclusion, a usage later critics would flag as a misreading.
The mix's institutional standing also rested on cost and governance. A two-index portfolio can be run for a few basis points, monitored by a board, and rebalanced on a calendar — properties that made it the default comparison line in consultant reports through the 1990s and 2000s.
The retail era arrived with index funds. As low-cost S&P 500 and aggregate bond index funds spread through 401(k) menus in the 1990s, a two-fund approximation of the institutional default became available to any account size. Balanced and target-date strategies built on the stock-bond pair later became the most common default investment in U.S. defined-contribution plans following the 2007 qualified-default regulations, a status documented in plan-level data reported to the Department of Labor.
What happened to 60/40 in 2022?
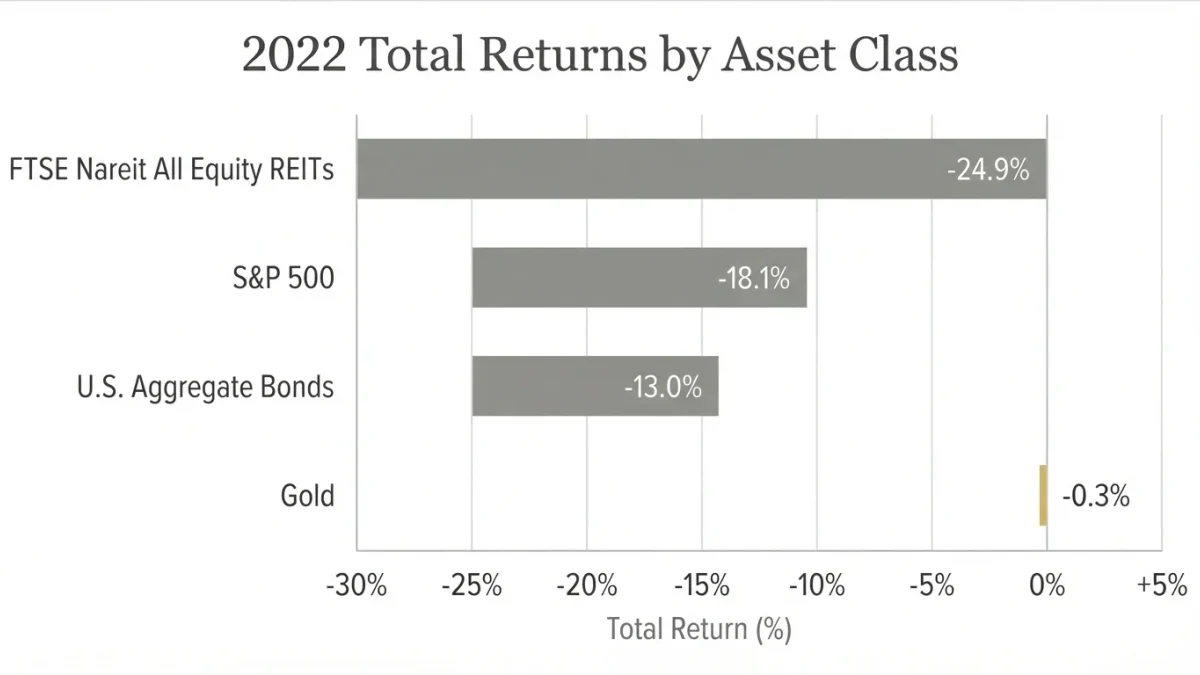
Both legs of the mix fell in the same year for the first time in decades. The Federal Reserve raised its policy target range by 4.25 percentage points across 2022, the 10-year Treasury yield climbed from about 1.5 percent at the end of 2021 to about 3.9 percent at the end of 2022 per U.S. Treasury data, and the S&P 500 returned minus 18.1 percent with the Bloomberg U.S. Aggregate Bond Index returning minus 13.0 percent.
An illustrative static calculation puts the combined damage near minus 16.1 percent: 60 percent of minus 18.1 plus 40 percent of minus 13.0, before costs, with no rebalancing assumed and all inputs stated above. Bloomberg and other financial press documented 2022 as among the worst years for U.S. balanced portfolios since the 1930s.
The mechanism was the positive stock-bond correlation. When yields rise because inflation and policy tighten, the discount-rate shock that hurts equities also hurts bonds, removing the offset that defined the mix's prior decades. The 2022 record showed the hedge failing precisely in the inflationary episode it had not been designed for.
How did the mix behave in 2023?
The rebound arrived quickly. The S&P 500 returned 26.3 percent in 2023 while the Aggregate returned 5.5 percent, which under the same illustrative static arithmetic produces roughly plus 17.8 percent for a 60/40 mix — assumptions identical to the 2022 calculation, no costs, no rebalancing.
Defenders read the pair of years as the mix working as documented: deep drawdowns punctuated by recoveries, with the long sample intact. Critics read the same pair as evidence that the bond leg's protection is conditional. Both readings appear in the published record; neither projects the future, and neither is adjudicated here.
The two-year span also illustrates a measurement caution. Calendar-year returns compress a path that passed through a 2022 trough and a 2023 recovery, so an account that entered or exited between those dates experienced a different sequence than either annual figure shows. The sequence-risk literature documents why the order of returns matters separately from their average.
What are the documented criticisms and defenses?
| Criticism | Documented basis | Documented defense |
|---|---|---|
| The founding study is misread | Jahnke's 1997 Financial Analysts Journal critique argued the 91.5 percent figure described time-series variation, not differences between plans | Xiong, Ibbotson, Idzorek, and Chen (2010) found allocation policy still accounts for a large share of return variation across plans |
| The bond hedge is regime-dependent | Stocks and bonds fell together in 2022 as yields rose about 2.4 points on the 10-year Treasury | Long samples include both correlation regimes; the 2000s and 2010s offset episodes are equally documented |
| The equity leg is concentrated | The ten largest S&P 500 constituents exceeded one-third of index weight by late 2024, per S&P Dow Jones Indices | Concentration is a property of cap weighting, not of the 60/40 split itself; other equity implementations exist |
| The scope is home-only | A U.S.-only mix excludes non-U.S. equities and currencies documented in global benchmarks | Currency exposure adds its own volatility; the domestic variant is the documented benchmark convention |
Is the debate about the split or about the inputs?
The published disagreement is less about the numbers 60 and 40 than about whether the 40 hedges the 60. That question is empirical and regime-dependent: the same stock-bond pairing offset drawdowns in 2008 and 2020 and amplified them in 2022, in each case for a stated macroeconomic reason.
Three structural points survive all readings. The mix is cheap to implement, its drawdowns are fully documented, and its behavior is driven by the correlation between its two legs rather than by the specific weights. Frameworks that alter one leg — global bonds, inflation-linked securities, real assets — are answering the correlation question, not the arithmetic one.
What the record does not contain is a settlement. The 2022 episode reopened a debate that the 2010s had closed in the mix's favor, and the 2023 rebound reopened the reopening. Readers weighing the convention against alternatives carry that unresolved record.