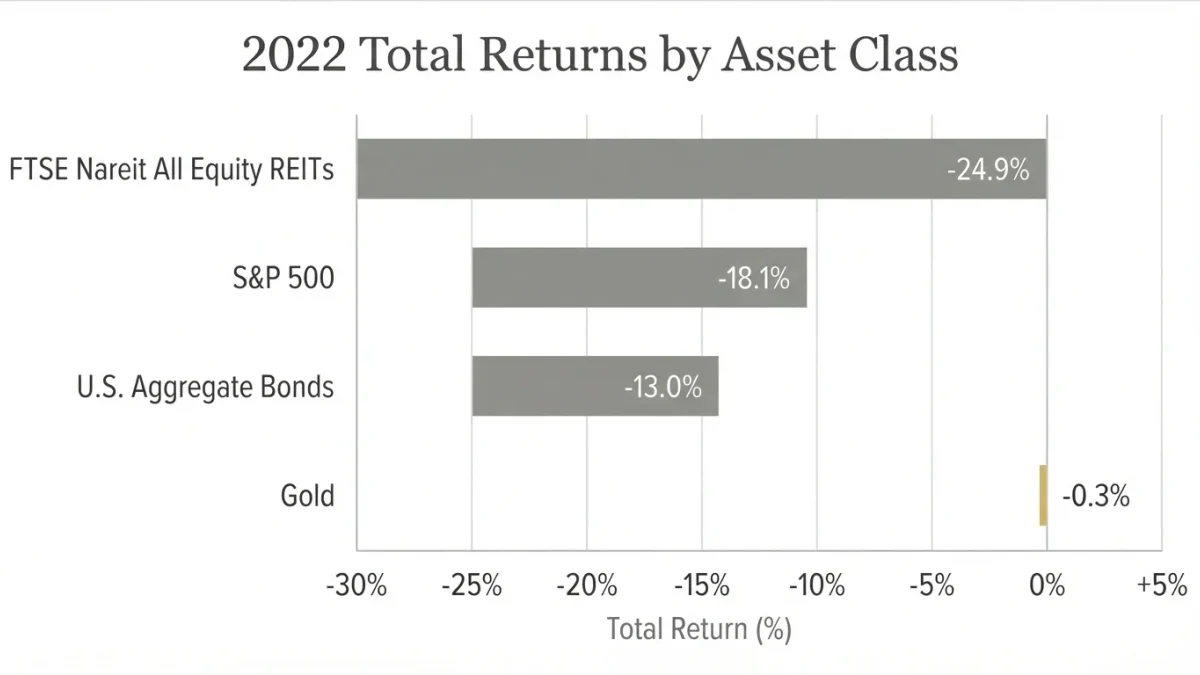

Diversification is measured with three documented families of metrics: correlation coefficients for co-movement, concentration indices for weight inequality, and effective-number measures for how many independent positions a portfolio behaves like. In 2022 the stock-bond correlation turned positive as the 10-year Treasury yield rose from about 1.5 percent to about 3.9 percent, per U.S. Treasury data.
This explainer documents how each family is computed, what it captured in recent market history, and where the published record says it fails.
What does correlation capture — and what does it miss?
The correlation coefficient scores the linear co-movement of two return series on a scale from minus one to plus one. It enters portfolio math directly: for two assets, portfolio variance equals the squared weights times variances plus a cross-term proportional to the correlation, so lower correlations reduce variance without changing any holding. Diversification's arithmetic lives in that cross-term.
What correlation misses is stability. Estimates depend on the window measured, and the same pair of assets produces different coefficients across decades — the stock-bond pairing was negatively correlated through much of the 2000s and 2010s and positively correlated in the inflationary 1970s and again in 2022. A coefficient read from a calm period describes that period, not the next one.
The deeper limitation is linearity. A correlation near zero can coexist with strong co-movement in tails, where diversification is needed most; the 2008 and 2022 records both show broad correlation spikes precisely during drawdowns. The metric summarizes the middle of the distribution while the portfolio's fate often sits at the edge.
How is concentration scored?
Concentration is measured on weights alone, ignoring returns entirely. The standard tool is the Herfindahl-Hirschman Index: the sum of squared portfolio weights, reaching its maximum of one for a single position. Antitrust enforcement uses the same arithmetic on market shares — the 2010 joint agency guidelines treat markets above 2,500 as highly concentrated — and portfolio analysis borrows the construction unchanged.
Applied to portfolios, the index makes weight inequality visible. The ten largest S&P 500 constituents exceeded one-third of index weight by late 2024, per S&P Dow Jones Indices, so a cap-weighted index fund — five hundred names on paper — carries the concentration profile of a far smaller portfolio. The number of holdings is a count; the HHI is a measure, and the two diverge whenever weights are unequal.
The documented limitation is blunt: concentration indices see nothing about how holdings co-move. Ten oil producers equally weighted score as perfectly diversified on the HHI while sharing a single risk factor. Concentration is half of the diversification question by construction.
What is the effective number of positions?
The effective number translates an index into holdings. Dividing one by the HHI yields the count of equally weighted, independent positions a portfolio behaves like — its effective number of positions. Equal weights maximize it; one dominant position collapses it toward one, whatever the nominal count says.
| Illustrative portfolio | Weights | HHI | Effective number |
|---|---|---|---|
| Ten equal stocks | 10 percent each | 0.100 | 10.0 |
| One dominant plus nine small | 55 percent, then 5 percent each | 0.325 | 3.1 |
| Two-asset mix | 60 / 40 | 0.520 | 1.9 |
The table is illustrative arithmetic on stated weights; no returns are assumed. The middle row is the caution: ten printed positions can behave like three, and the balance sheet of holdings will not say so.
The correlation-aware extension is documented. Meucci's 2009 Risk magazine framework, 'Managing Diversification,' applies the same effective-number logic to the eigenvalues of the correlation matrix — producing an effective number of bets that falls when positions co-move, even at equal weights. It answers the question the plain effective number cannot: diversified into what?
How are the metrics computed in practice?
The computation is a documented sequence, and each step records the choice that shapes the result:
- Collect the portfolio's weights and state them on a single date — stale weights distort every downstream figure.
- Square each weight and sum the squares to obtain the HHI; report it in points or as a decimal, stating which.
- Divide one by the HHI to obtain the effective number of positions.
- Estimate pairwise correlations over an explicitly stated window — three- and five-year monthly windows are common conventions in the practitioner literature.
- For the correlation-aware extension, decompose the correlation matrix and apply the effective-number logic to its eigenvalues, per Meucci's framework.
Every step's output is a summary of its inputs, so the stated window and the weight date belong in any reported figure. Practitioner documents describe most disputes about diversification numbers as disputes about these two choices in disguise.
How do the metrics fail together?
Each family fails in a different direction, which is why the documented practice is to read them together. Correlation describes co-movement but not weights; concentration describes weights but not co-movement; effective numbers compress both into one figure at the cost of the detail behind it.
| Metric | What it captures | Documented limitation |
|---|---|---|
| Correlation coefficient | Linear co-movement between two holdings | Unstable across windows; silent on tail co-movement |
| Herfindahl-Hirschman Index | Weight inequality across holdings | Ignores co-movement entirely; ten same-factor names score as diversified |
| Effective number of positions | Holdings implied by the weight distribution | Correlation-blind unless extended, as in eigenvalue-based variants |
| Effective number of bets | Independent risk factors behind the portfolio | Requires estimated correlation matrices, with their own instability |
The 2022 record shows the joint failure mode. Stock-bond correlations turned positive as yields rose, concentration in the equity benchmark was at record documented levels, and portfolios that scored well on every metric before the year still drew down together. The metrics measured what they were built to measure; the regime moved.
The Securities and Exchange Commission's investor education materials at investor.gov frame diversification across asset classes, sectors, and geographies — a framing the metrics above quantify. Reading them as a set, with each one's failure documented, is the practice the professional literature describes.