Sequence-of-returns risk is the risk that the order in which returns arrive, rather than their long-run average, determines how long a portfolio funding withdrawals lasts. William Bengen's 1994 analysis in the Journal of Financial Planning, built on U.S. market data back to 1926, established the widely cited 4% initial withdrawal finding that made the sequence problem explicit.
This article explains a documented risk mechanism and the research around it; it recommends no strategy and states no withdrawal rate for any reader.
What is sequence-of-returns risk?
Sequence-of-returns risk is the sensitivity of a portfolio's longevity to the timing of gains and losses. Two portfolios can experience the same returns in the same amounts over twenty years and end differently if one withdraws cash along the way, because withdrawals lock in whatever the market did in the year they were taken.
The risk is asymmetrical across life stages. During accumulation, with no withdrawals, the order of returns is mathematically irrelevant: multiplication commutes, and the ending balance is identical. Once withdrawals begin, an early loss operates twice — it shrinks the portfolio directly, and the withdrawal removes additional capital that is never present for the recovery to compound on.
Why does the order matter more than the average?
An illustrative model isolates the effect. Assume a $100,000 portfolio, a $5,000 withdrawal at the start of each year, and two five-year return paths that contain exactly the same annual returns in opposite order: a strong-early path of +20%, +18%, +10%, −6%, −7% and a weak-early path of −7%, −6%, +10%, +18%, +20%. Both average +7.0% per year.
| Scenario | Average annual return | Value after five years |
|---|---|---|
| Strong-early path, $5,000 yearly withdrawals | +7.0% | $109,854 |
| Weak-early path, $5,000 yearly withdrawals | +7.0% | $101,168 |
| Either path, no withdrawals | +7.0% | $136,165 |
The figures are illustrative arithmetic computed from the stated assumptions; real portfolios face taxes, inflation adjustments, and uneven withdrawals. The structural result holds regardless: identical averages, identical total returns, and a five-figure gap produced by order alone.
When is the exposure highest?
Exposure peaks in the years immediately before and after withdrawals begin. Losses taken while the balance is at its largest do the most damage, because both the loss and every subsequent withdrawal draw on a diminished base; later losses hit a portfolio that has already been drawn down for years.
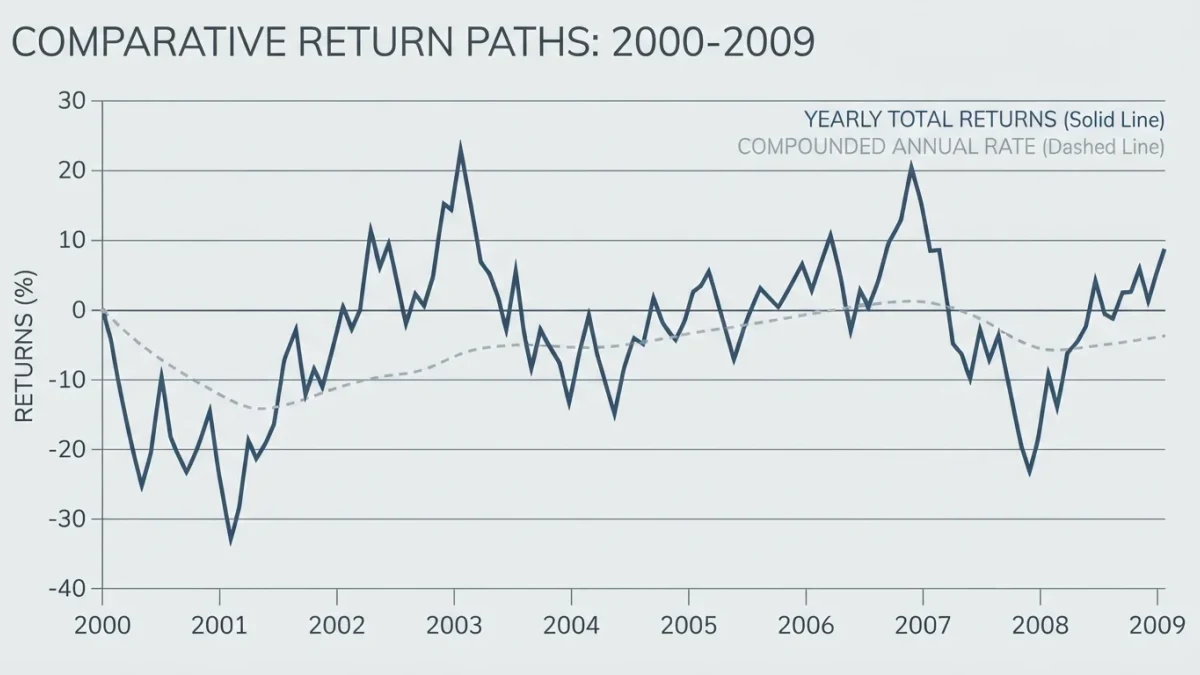
The decade beginning January 2000 is the documented stress case for U.S. retirees. The S&P 500's price level fell from 1,469.25 at the end of 1999 to 1,115.10 at the end of 2009, an annualized price decline of about 2.7%, and reinvested dividends brought annualized total return to roughly −1.0% (S&P Dow Jones Indices data). A 2000 retiree withdrawing from a portfolio measured against that index faced early losses lasting years, the exact configuration sequence risk names.
What did the documented studies find?
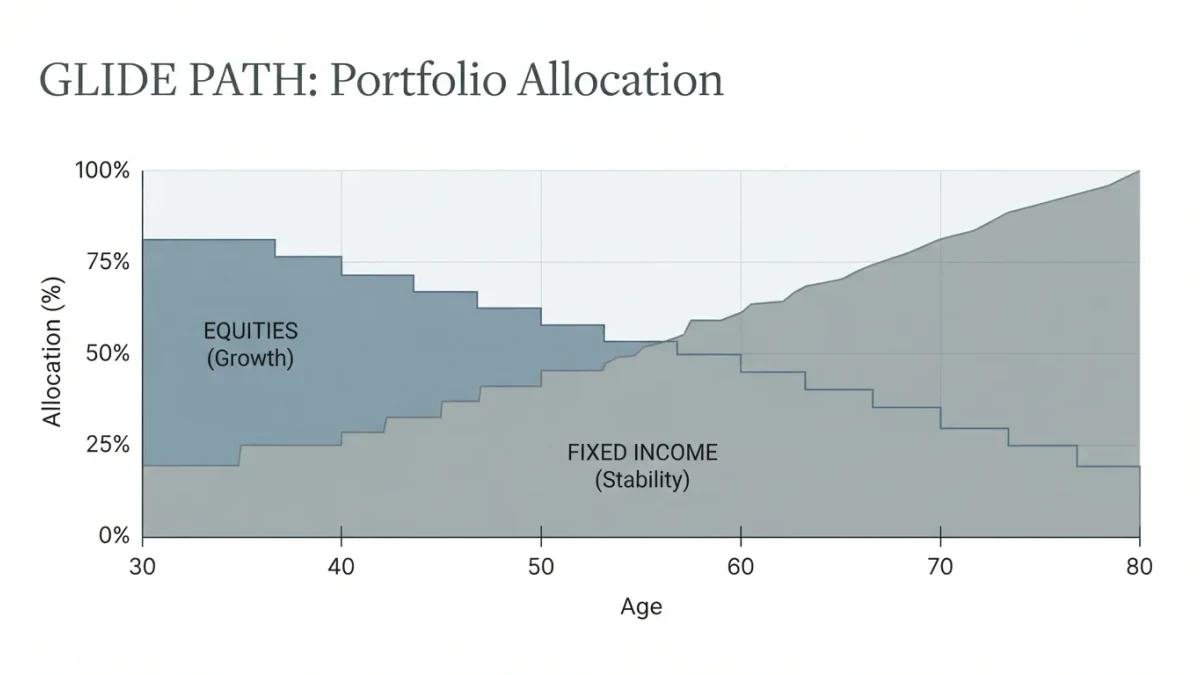
Bengen's 1994 study tested rolling 30-year retirements on U.S. stock and bond data from 1926 forward and reported that a 4% initial withdrawal, inflated annually, survived the worst historical cohorts he tested, with allocations between roughly 50% and 75% in stocks supporting the result. The finding concerned U.S. history through 1992, not a guarantee about future markets.
Later work tested its boundaries. Wade Pfau's Journal of Financial Planning research in the 2010s showed that safe withdrawal rates are highly sensitive to the returns of the first retirement decade and that international datasets produced lower sustainable rates than the U.S. record. Guyton and Klinger's 2006 decision-rule framework demonstrated that rules governing inflation adjustments and discretionary spending could raise sustainable initial rates, at the cost of variable income.
Which documented mitigations exist, and with what criticisms?
Four approaches appear repeatedly in the literature, each with documented trade-offs and no consensus winner.
| Approach | Documented rationale | Documented criticism |
|---|---|---|
| Flexible spending rules | Reduce withdrawals after losses to protect the base (Guyton and Klinger, 2006) | Retirees bear income volatility precisely in bad markets |
| Cash reserve segments | Hold near-term withdrawals apart from volatile assets to avoid selling in drawdowns | Cash drag in strong markets; no rule fixes the segment sizes |
| Partial annuitization | Convert part of the portfolio to lifetime income, transferring longevity and sequence risk | Irrevocable, fee-laden, and credit- or insurer-dependent |
| Allocation policy | Bengen's tested stock-bond ranges balanced growth against drawdown depth | No allocation removes the risk; deeper equity drawdowns cut both ways |
These are presented as documented frameworks for study, not as recommendations. Each shifts who bears the risk — retiree, insurer, or market — rather than deleting it.
How is the risk monitored?
Practitioners observe two measurable indicators: the portfolio's drawdown in the first retirement decade, and the ratio of current withdrawals to the remaining balance. Longevity modeling typically runs historical sequences or Monte Carlo simulation across thousands of orderings; results are statements about modeled distributions, never predictions.
The SEC's investor materials on managing lifetime income describe how withdrawal planning interacts with Social Security and longevity, and they frame the problem this article has kept central: in the withdrawal phase, when returns arrive can matter as much as what they average.