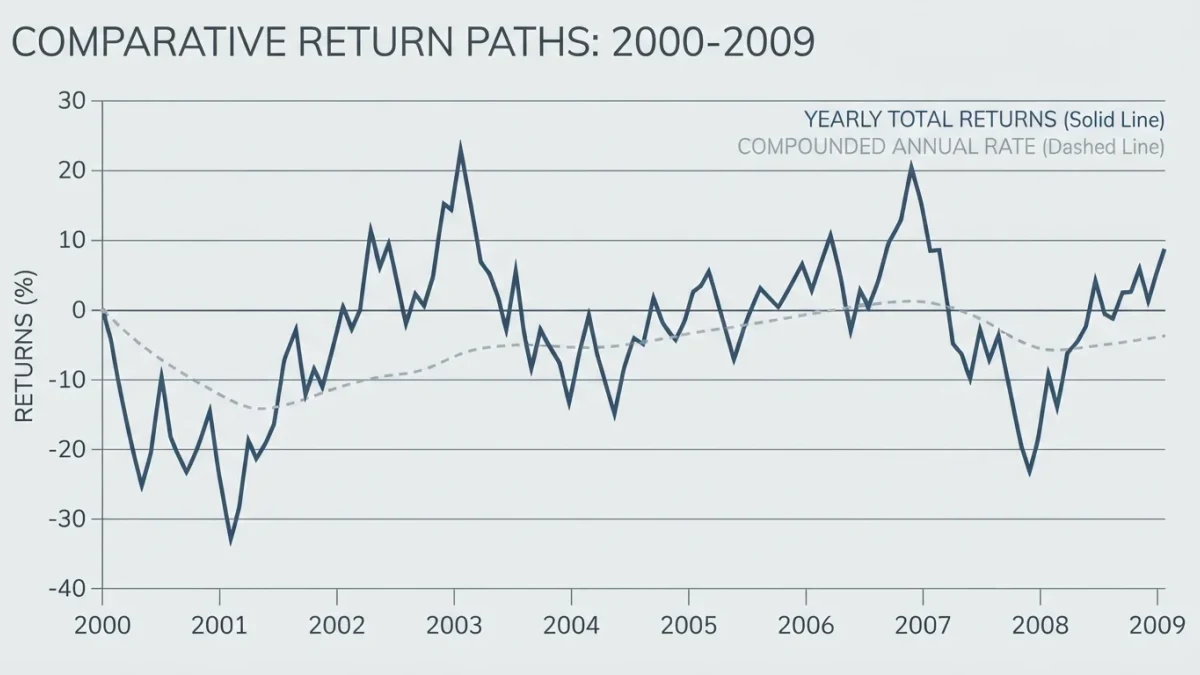
CAGR, or compound annual growth rate, is the constant yearly rate at which a starting value would have grown to reach a stated ending value over a given span. Across 2000-2009, the S&P 500's annual returns averaged +1.2%, yet the compounded result was −1.0% per year (S&P Dow Jones Indices data).
Horison publishes information, not investment advice, and what any growth-rate figure implies for a decision depends on individual circumstances this publication cannot know. Historical CAGRs describe the past exclusively; none is projected forward here, and nothing is recommended.
How is CAGR computed?
CAGR takes two endpoints and a span of years and reports the one constant rate that connects them. The formula divides the ending value by the beginning value, takes the n-th root where n is the number of years, and subtracts one. The result is a geometric quantity: it depends on the endpoints and the elapsed time, and on nothing in between.
An illustrative example shows the mechanics. A holding that doubles from $10,000 to $20,000 in four years has a CAGR of 18.9% per year, because 1.189 compounded four times doubles the starting amount. The same figure applies whether the path ran steadily, crashed first, or spiked last — a property that is both CAGR's virtue and its main trap.
How does CAGR differ from an average of annual returns?
The average of annual returns is an arithmetic mean: add the yearly figures, divide by the count. CAGR is a geometric mean: the constant rate that reproduces the same endpoint. The two coincide only when every year is identical, and the geometric figure is always the lower one whenever returns vary.
The simplest illustration is two years at +50% and −50%. The arithmetic average is 0%, yet $10,000 becomes $15,000 and then $7,500 — a CAGR of about −13.4% per year. The order does not matter for the endpoint; the variability alone produces the shortfall, which is why CAGR, not the average, is the honest measure of realized growth.
What is volatility drag?
Volatility drag is the documented name for that shortfall: the amount by which the geometric (compounded) return falls below the arithmetic average of the same returns. A standard approximation in financial mathematics puts the drag near one-half of the variance of returns, so choppier series surrender more of their average.
The 2000-2009 S&P 500 record gives a full-scale example. The ten annual total returns averaged +1.2%, yet the decade compounded at about −1.0% per year — a gap of more than two points annually between what the years averaged and what a holder realized. Drawdowns took back part of each gain, and only the compounded figure registers the fact.
Where is CAGR commonly misused?
Four patterns recur in marketing and commentary, each documented enough to have standard cautions.
- Cherry-picked windows: short spans, or trough-to-peak measurements, produce flattering rates that longer windows on the same asset do not confirm.
- Ignored cash flows: deposits and withdrawals change the ending balance without any growth occurring. When money moved in or out, the endpoint-only formula misstates performance, and a money-weighted return such as IRR is the correct instrument.
- Mismatched comparisons: CAGRs computed over different periods or on different bases — price versus total return — are not comparable, yet they are routinely printed side by side.
- Implied smoothness: a stated CAGR suggests a steady path that never existed. The volatility that produced drag is invisible in the single number, so the figure understates the risk carried to obtain it.
Which measure answers which question?
The three growth measures in circulation answer different questions, and misreadings usually trace to applying one where another belongs.
| Measure | Answers | Fails when |
|---|---|---|
| CAGR (geometric) | At what constant rate did the value grow between two dates? | Cash flowed in or out; window is cherry-picked |
| Arithmetic average | What did a typical single year average? | Used as a forecast of long-run growth — it exceeds the compounded result |
| Money-weighted return (IRR) | What return did this specific account's cash flows earn? | Compared across accounts with different flow timing |
The arithmetic figure answers a fair question about typical single-period magnitude; the geometric figure answers what actually compounded. Forecasting applications carry a further caution: building projections on arithmetic averages overstates long-horizon growth precisely because of the drag documented above.
How should a CAGR statement be read?
Four checks turn a quoted rate into an interpretable one: confirm the start and end dates, confirm the return basis, ask whether any cash flowed during the span, and ask what neighboring windows show. A rate that survives those checks describes the past cleanly; one that does not is a number looking for a story.
The SEC's compound interest calculator on Investor.gov lets a reader run constant-rate compounding on any inputs, which is exactly the assumption CAGR states. Used with the checks above, CAGR is the standard summary of realized growth — smooth by construction, honest only with its dates attached.