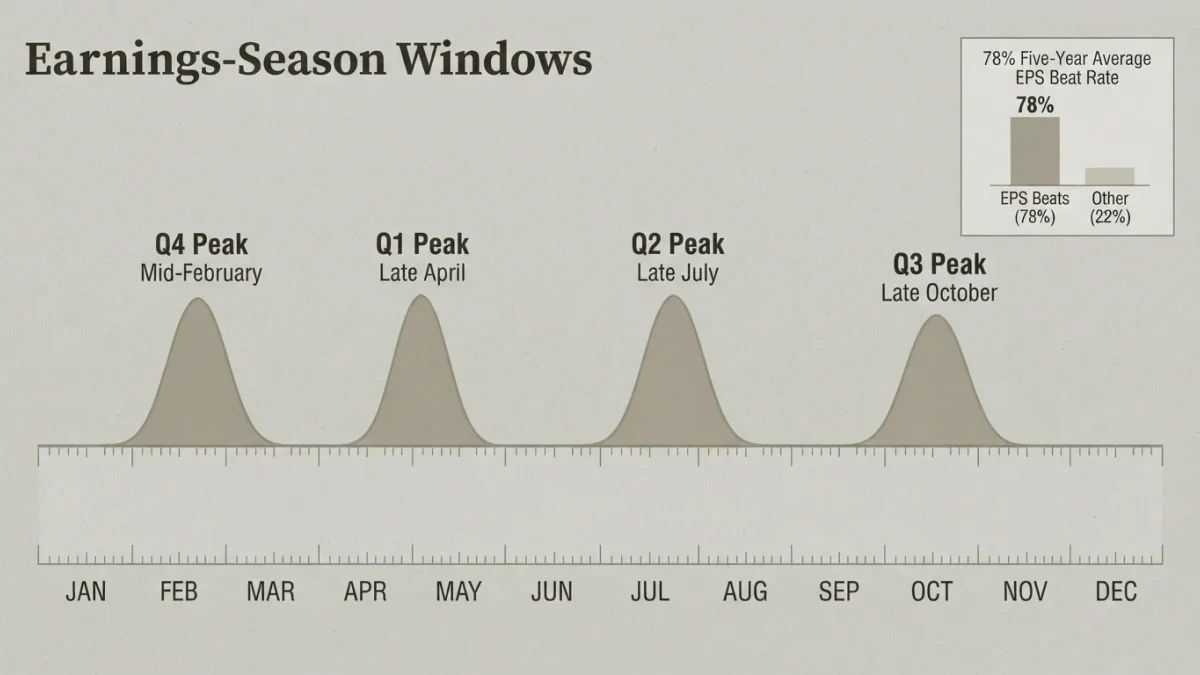
Earnings season is the stretch of roughly six weeks beginning in mid-January, April, July, and October, when most U.S.-listed companies report quarterly results. In the fourth-quarter 2025 season, 75 percent of S&P 500 companies reporting by January 30, 2026 beat consensus estimates, per FactSet's Earnings Insight.
This is a process explainer — how reporting, estimates, and guidance fit together — and nothing here is a recommendation about any security.
When does earnings season happen, and who reports first?
The calendar is anchored to quarter-ends. Reporting begins roughly two weeks after a quarter closes, when the largest banks traditionally open each season, and peaks in the third through sixth weeks. By the eighth week, the bulk of major indexes has reported and attention shifts back to economic data.
The four windows follow the same pattern each year:
| Season | Reports on | Peak weeks |
|---|---|---|
| First-quarter season | January – February | Late January to mid-February |
| Second-quarter season | April – May | Late April to mid-May |
| Third-quarter season | July – August | Late July to mid-August |
| Fourth-quarter season | October – November | Late October to mid-November |
Not every company follows the rhythm. Fiscal years that end outside December shift some reporters to off-season months, which is why a handful of releases appear year-round. The official record for every U.S. filer is the quarterly 10-Q or annual 10-K filed with the Securities and Exchange Commission, not the press release.
What is a consensus estimate?
A consensus estimate is the aggregated forecast of professional analysts for a company's next quarterly results — typically earnings per share (EPS) and revenue, sometimes with detail by segment. Data providers such as FactSet, LSEG, and Bloomberg collect the individual forecasts and publish the mean or median as the consensus for each line item.
The consensus is a snapshot, not a standard. It moves as analysts revise after company guidance, pre-announcements, or industry news, so the number a company is measured against depends on when the measurement is taken. The earnings surprise is the gap between the reported figure and that consensus: a positive surprise is conventionally called a beat, a negative one a miss, and a small gap an in-line result.
Why do most companies beat estimates?
Beats are the norm, not the exception. Per FactSet's Earnings Insight series, 78 percent of S&P 500 companies reported EPS above consensus on average over the five years through 2025, and 76 percent over ten years. In the fourth-quarter 2025 season, with 33 percent of the index reported as of January 30, 2026, the beat rate stood at 75 percent.
The most documented explanation is managed expectations. Companies issue guidance that analysts anchor to, and a company that guides conservatively sets a bar it can clear. Because a miss is typically punished more sharply than a beat of the same size is rewarded, the incentive to under-promise is structural. The result: the surprise is usually positive, and reading it as a signal of strength conflates company performance with expectation-setting.
What is guidance, and why does it often matter more than the beat?
Guidance is management's own outlook for coming quarters — ranges for revenue, earnings, margins, or other measures, issued with the report or on the conference call. Unlike the backward-looking report, guidance is forward-looking, and market commentary has long documented that same-day stock reactions often track revisions to the outlook more than the size of the reported beat.
A company can beat consensus and see its shares fall when guidance disappoints, and miss while rising when the outlook improves. For a reader, that makes the sequence of a release worth more than its headline: reported quarter first, then the outlook, then how analysts revise their estimates over the following days — the revisions are where the information gets absorbed.
How should a reader work through an earnings report?
A repeatable process keeps the pieces in order:
- Compare headline EPS and revenue against the consensus, and note when the estimates were last revised.
- Distinguish adjusted figures from GAAP figures, and identify what the adjustments exclude.
- Read the full 10-Q or 10-K, where the reporting requirements are stricter than in a press release.
- Weigh guidance as a stated outlook with assumptions attached, not a promise or a forecast the reader must accept.
- Track analyst revisions in the days after, since they aggregate how the market absorbed the release.
What happens on the day of a release?
A typical release follows a set sequence. The company files the press release as an 8-K current report with the SEC and distributes it through wire services, usually before the open or after the close. Management then holds a conference call — prepared remarks first, analyst questions after — where guidance and detail beyond the press release are discussed. The filed 10-Q or 10-K follows within the regulatory deadline.
Timing matters for how reactions form. After-hours volume is thin, so an initial move on an evening release can exaggerate or reverse by the next regular session, and a pre-market release prices into the opening auction instead. Neither venue is more informative; both simply process the same release under different liquidity conditions.
The adjusted-versus-GAAP distinction deserves its own caution. Adjusted figures exclude items management labels non-recurring — restructuring, impairments, stock-based compensation — and two companies in the same industry can adjust differently, so an adjusted beat does not certify an accounting-level result. Reading both figures together, with the reconciliation table between them, is the practice disclosure rules are designed to support.
What are the limits of earnings-season data?
Three limits frame any single season. First, results describe a quarter that ended weeks before publication, so they are history by the time they print. Second, the consensus moves, and a beat against a revised-down consensus can be weaker news than a miss against a raised one. Third, one quarter is noise-length for long-horizon investors; the documented long-term case for equities rests on years of compounded earnings, not on any season's surprise tally.
Seasonal aggregates carry the same caveat. A quarter in which 78 percent of index members beat estimates says something about expectation-setting in that period; it does not establish that the underlying earnings grew by a matching amount, and it predicts nothing about the next season.