
Margin debt — the debit balances investors carry at U.S. brokerage firms — reached 1,415,557 million dollars, about 1.416 trillion, as of May 2026, per FINRA's monthly margin statistics, the latest release published before July 9, 2026. The figure rose 8.5 percent from April's 1,304,281 million and marked the ninth straight monthly increase, per commentary tracking the series.
HORISON publishes information, not investment advice. The figures are covered for their educational content — what borrowed money in brokerage accounts measures and what it cannot tell — and imply nothing about what anyone should do.
What did the FINRA data show for May 2026?
Three readings stand out in the release. Debit balances in customers' securities margin accounts totaled 1,415,557 million dollars, a record for the series. April 2026 had stood at 1,304,281 million, making the May increase about 111 billion dollars in a single month. Free credit balances in cash accounts — uninvested cash held alongside margin accounts — were 206,600 million dollars.
Contextual commentary extends the picture. Analysis by CurrentMarketValuation puts the May level roughly 47 percent higher than a year earlier, and RealInvestmentAdvice notes the series has set records through early 2026 while margin debt as a share of total market capitalization, near 2.2 percent, remains below the peaks of prior cycles — a reminder that record nominal levels partly reflect rising market values.
What does margin debt measure — and what doesn't it tell?
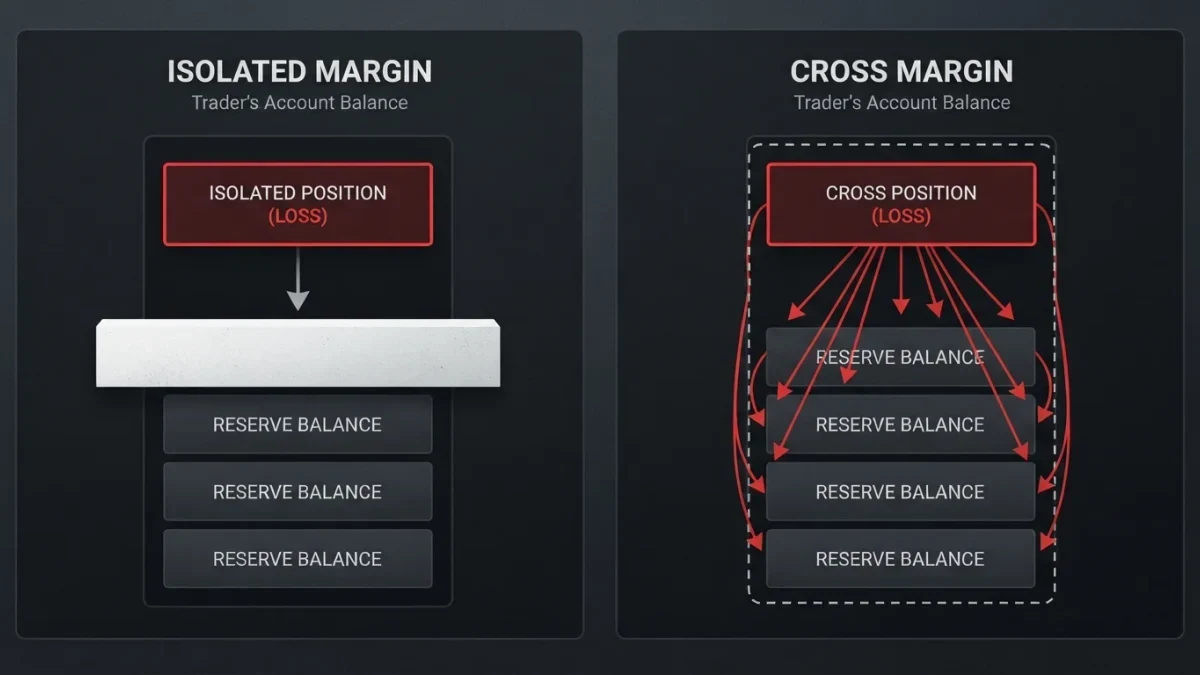
Margin debt measures leverage: investors borrow against the value of securities they hold, with Federal Reserve Regulation T setting the initial margin requirement for equities at 50 percent and FINRA rules requiring maintenance margins of at least 25 percent in most cases, per FINRA's published guidance. When balances rise, more borrowed money is financing positions; when markets fall, forced selling can follow maintenance calls.
What the series does not provide is a timing signal. Margin debt has hit records in periods that continued rising and in periods that preceded drawdowns, and analysts who scale it against market capitalization — as the cited commentary does — reach more measured conclusions than the nominal headline suggests. The May 2026 number documents how much leverage investors carried; it says nothing documented about what follows.