A market-cap-weighted index gives each constituent a weight proportional to its total market value, while an equal-weight index gives every constituent the same weight and rebalances back to it on a schedule. In calendar 2024 the S&P 500 returned 25.0% while the S&P 500 Equal Weight Index returned about 13%, per S&P Dow Jones Indices data.
This article documents how the two structures work and what the recorded differences have been; past gaps are not projected forward, and nothing here is a recommendation.
How is each index constructed?
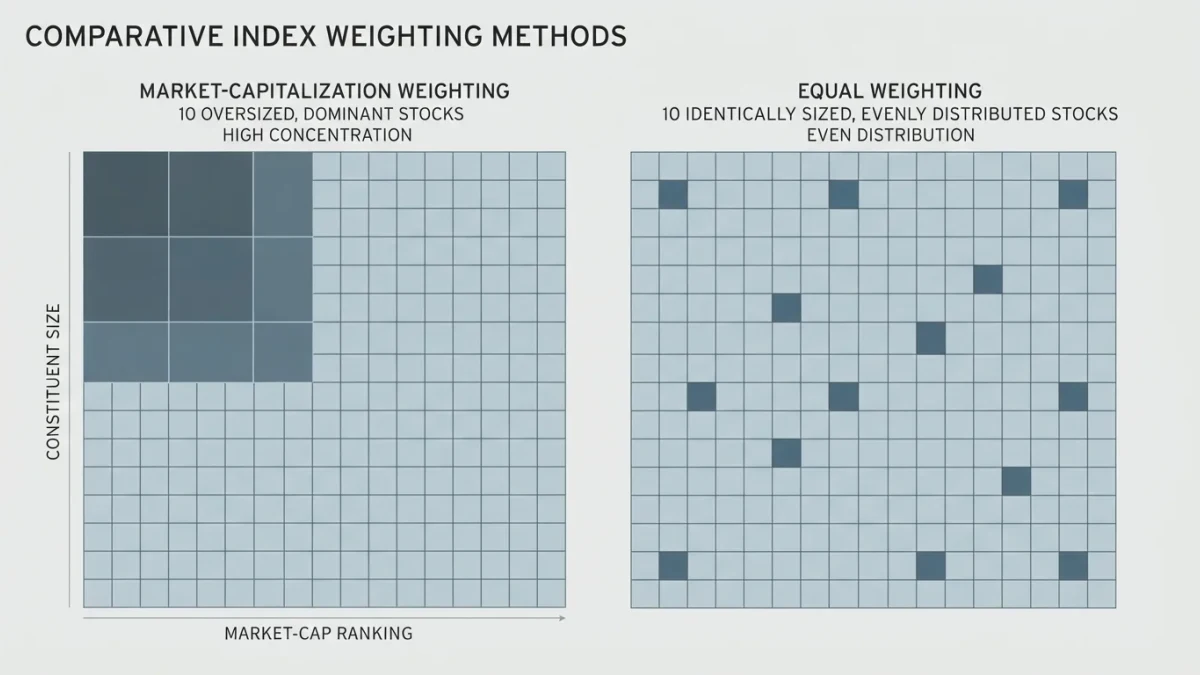
In a market-cap-weighted index, each stock's weight equals its market value divided by the total market value of all constituents, typically using free-float shares. The weights move with prices, so the index rebalances itself continuously: a stock that rises gains weight automatically, and no committee trades it back to any target.
In an equal-weight index, every constituent starts at the same weight, 1 divided by the number of names. Prices immediately pull weights apart, so the index must rebalance back to equality on a fixed schedule — quarterly for the S&P 500 Equal Weight Index, which dates to 2003. That rebalancing is not decoration; it is the mechanical act that keeps the index equal-weighted at all.
What drives the return differences?
Three mechanisms separate the two series. The first is concentration: the ten largest constituents approached 40% of the cap-weighted S&P 500 at the end of 2024, per S&P Dow Jones Indices data, while ten names in an equal-weight version of roughly 500 constituents account for about 2%. When the largest stocks lead, cap weight leads; when they lag, equal weight has the structural advantage, as the 2024 figures show in reverse.
The second is size tilt. Equal weighting allocates far more relative weight to the index's smaller constituents than their market values justify, so the series behaves partly like a mid- and small-cap tilt grafted onto the same name list. The third is systematic rebalancing: restoring equal weights means trimming winners and adding to losers on schedule, a contrarian trade that S&P DJI research credits with part of equal weight's long-run record.
S&P DJI's research papers, including "The Not-So-Weird Siblings" (2021), document that equal weight outperformed cap weight over long multi-decade spans of the shared history, while cap weight dominated stretches such as the 2010s and the 2023-2024 mega-cap rally. Neither series led continuously; the record itself is the finding.
How do the risk profiles compare?
The documented risk differences follow from the same mechanisms. Equal weight has historically run with higher volatility and a higher beta to the broad market, because smaller constituents swing harder and the quarterly rebalancing adds turnover. Cap weight concentrates its risk at the top: a record top-ten share means index-level results depend on a narrow set of names.
Drawdown behavior differs accordingly. Equal weight's smaller-constituent tilt has historically deepened losses when small caps fall harder than mega-caps, while cap weight's losses concentrate when the largest names correct after long rallies. Neither profile is safer in the abstract; the risks simply sit in different places.
| Feature | Market-cap weighted | Equal weighted |
|---|---|---|
| Constituent weight | Proportional to market value | Identical for all names |
| Rebalancing | Continuous, automatic via prices | Scheduled (quarterly for the S&P 500 Equal Weight Index) |
| Top-10 share, end-2024 | Approached 40% of the index | About 2% of the index |
| Size exposure | Tilt toward the largest companies | Tilt toward smaller constituents |
| Turnover and costs | Low; trades mainly on index changes | Higher; every rebalance trades the whole book |
| Documented criticism | Concentration risk at record top-ten share | Higher volatility and transaction drag |
What are the documented criticisms of each design?
The cap-weighted design is criticized for buying more of whatever has already risen — momentum built into the rules — and for concentrating exposure precisely when valuations of the largest names stretch. Critics of equal weight point to its higher turnover, which raises transaction costs inside tracking funds, and to its heavier tax footprint, since scheduled rebalancing realizes gains that cap-weighted indexes rarely trigger.
Both criticisms are documented and directional rather than decisive. Each design rewards a different market regime, and the historical record shows long stretches where either led by wide margins — the 2000s favored equal weight, the 2010s favored cap weight.
What should a reader take from the 2024 example?
The 2024 gap of 25.0% versus about 13% is a single year, and single years exaggerate every mechanism. Its value is diagnostic: the same 500 companies produced two very different results because weighting rules amplified the largest names in one series and neutralized them in the other.
Investor.gov's materials on smart beta and non-traditional index funds describe how alternatively weighted products are marketed and what questions they raise. The comparison belongs to that literature: a documented structural difference with a long, mixed record — not a ranking of strategies, and not a forecast of which rule leads next.