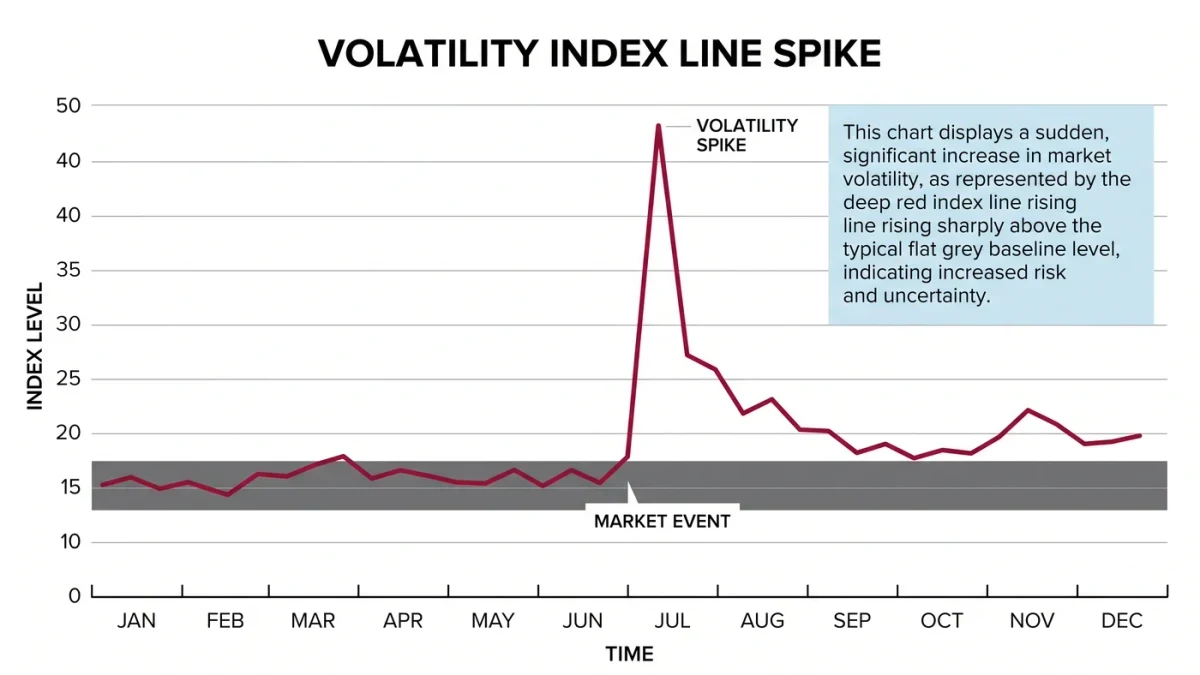
The VIX is the Cboe Volatility Index: one number, quoted in annualized percentage points, that measures expected S&P 500 volatility over the next 30 days, derived from index-option prices. It closed at a record 82.69 on March 16, 2020, per Cboe historical data, against a long-run closing average near 19.
This explainer covers what the index measures, its documented history, and the limits of interpreting it; it recommends no strategy based on VIX levels.
What does the VIX actually measure?
The index measures implied volatility — the volatility expectation embedded in option prices, not the volatility that has already happened. Cboe computes it from a broad strip of out-of-the-money S&P 500 call and put prices expiring over the next 30 days, aggregating them into a variance estimate and taking its square root. The result is quoted in annualized percentage terms.
The annualization makes a VIX of 20 easier to translate: 20 divided by the square root of 12 is about 5.8 percent, meaning the options market priced roughly a one-in-three chance — one standard deviation under the model's assumptions — of the S&P 500 moving more than 5.8 percent in either direction over the next month. The calculation rests on model assumptions that option pricing uses throughout, and those assumptions, not only sentiment, shape the output.
Where did the index come from?
The documented timeline has four dates. Cboe introduced the VIX in 1993 as a measure of at-the-money implied volatility on the S&P 100. In 2003 the methodology was redesigned, with a model developed with Goldman Sachs, to use the full strip of S&P 500 options, which is the calculation in use today. VIX futures launched in 2004, and VIX options followed in 2006, per Cboe's published index history.
The 2004 futures launch matters for readers because most investable VIX products track futures, not the index itself. The spot VIX is a calculated statistic; the futures curve is a tradable market with its own pricing, and the two diverge in ways covered below.
What do VIX levels mean — and not mean?
Commentary commonly uses descriptive bands, and the record gives them anchors. The long-run closing average sits near 19. The all-time closing high of 82.69 came on March 16, 2020, at the depth of the pandemic selloff, per Cboe data. On February 5, 2018, the index rose 115.6 percent to close at 37.32 — its largest one-day percentage jump on record — and the episode, which stressed products betting on calm volatility, led Credit Suisse to terminate its inverse-volatility ETP XIV that month.
| VIX range | Common reading | Documented anchor |
|---|---|---|
| Below 15 | Below-average expected volatility | Frequent in calm markets |
| 15 – 20 | Near the long-run average | Long-run average near 19 |
| 20 – 30 | Elevated expected volatility | Common in selloffs |
| Above 30 | Stress episodes | Record close 82.69, March 16, 2020 |
What levels do not carry is directional information. A high VIX documents that protection was expensive when the reading was taken; it does not establish that stocks will fall, and the index has reached elevated readings that preceded both declines and recoveries. The bands above are descriptions of where readings have clustered, not signals with documented predictive power.
Mechanically, spikes are driven by hedging demand. When investors rush to buy index puts, dealers who sell that protection raise option prices, and the VIX computation registers the change — the index rises because protection became expensive, not because anyone surveyed participants about their feelings. That is also why the VIX can jump on days when the S&P 500 falls only modestly: what moves the calculation is the price of insurance, not the size of the decline alone.
What is VIX term structure?
Term structure is the shape of the VIX futures curve — the prices of futures contracts expiring in successive months. In calm conditions the curve slopes upward, a state called contango: longer-dated futures trade above the spot index. In stress the curve can invert to backwardation, with near-dated futures above longer-dated ones, because expected volatility spikes now and is assumed to decay later.
The shape has a documented mechanical consequence for funds. A long-volatility ETP that holds futures and rolls them monthly buys dearer-dated contracts in contango, which erodes value over time even when the spot VIX is flat — the dynamic behind the long-run losses of most long-volatility products. Term structure, not the VIX level alone, determines that drag.
What are the documented limits of reading the VIX?
Four limits recur in options research. First, the index is a risk-neutral expectation: it blends genuine volatility expectations with compensation demanded for selling protection, and the two cannot be separated in the quote. Second, it is one index on one underlying — the S&P 500 — so it says nothing about single-stock volatility, rates markets, or crypto assets. Third, model dependence: the strip-to-variance calculation embeds assumptions about option pricing that hold imperfectly, especially in fast markets.
Fourth, products are not the index. The February 2018 episode is the documented case study: an overnight spike in VIX futures forced the wind-down of inverse ETPs, and long-side products suffered roll losses even in weeks when spot VIX rose modestly. Reading the VIX requires keeping the statistic, the futures curve, and any tracking product conceptually separate.
One documented statistical property frames long-run readings: volatility clusters. High-volatility days cluster together and calm stretches persist, and the VIX mean-reverts toward its long-run average over time — a pattern documented across decades of options and returns data. Mean reversion is a statement about the distribution of readings, not a timetable for any particular episode, and products built on that property still face the roll dynamics described above.
How does the VIX fit a portfolio framework?
Within allocation work, the VIX functions as an input to risk assessment, not an allocation trigger. Documented uses include position sizing under volatility targeting, where a higher expected volatility reading scales exposure down mechanically, and as a monitoring signal for when option-based strategies are pricing unusual protection costs. Both uses treat the reading as information about current pricing, not as a prediction.
The honest summary is narrow. The VIX is well-defined, continuously quoted, and deeply documented; what it measures is a 30-day option-implied expectation with model assumptions attached. Treating it as a fear gauge is shorthand, and treating it as a forecast is a category error the record does not support.